 국립중앙도서관 "우편 복사 서비스"로 연결 됩니다.

 KISS
KISSTypical Q methodology studies include either tables of statements or sorting grids with statement numbers representing the views of each factor that has emerged within the study. Yet it could be useful to Q methodologists to have a simpler, more visua...
다국어 입력
あ
ぁ
か
が
さ
ざ
た
だ
な
は
ば
ぱ
ま
や
ゃ
ら
わ
ゎ
ん
い
ぃ
き
ぎ
し
じ
ち
ぢ
に
ひ
び
ぴ
み
り
う
ぅ
く
ぐ
す
ず
つ
づ
っ
ぬ
ふ
ぶ
ぷ
む
ゆ
ゅ
る
え
ぇ
け
げ
せ
ぜ
て
で
ね
へ
べ
ぺ
め
れ
お
ぉ
こ
ご
そ
ぞ
と
ど
の
ほ
ぼ
ぽ
も
よ
ょ
ろ
を
ア
ァ
カ
サ
ザ
タ
ダ
ナ
ハ
バ
パ
マ
ヤ
ャ
ラ
ワ
ヮ
ン
イ
ィ
キ
ギ
シ
ジ
チ
ヂ
ニ
ヒ
ビ
ピ
ミ
リ
ウ
ゥ
ク
グ
ス
ズ
ツ
ヅ
ッ
ヌ
フ
ブ
プ
ム
ユ
ュ
ル
エ
ェ
ケ
ゲ
セ
ゼ
テ
デ
ヘ
ベ
ペ
メ
レ
オ
ォ
コ
ゴ
ソ
ゾ
ト
ド
ノ
ホ
ボ
ポ
モ
ヨ
ョ
ロ
ヲ
―
http://chineseinput.net/에서 pinyin(병음)방식으로 중국어를 변환할 수 있습니다.
변환된 중국어를 복사하여 사용하시면 됩니다.
예시)
- 中文 을 입력하시려면 zhongwen을 입력하시고 space를누르시면됩니다.
- 北京 을 입력하시려면 beijing을 입력하시고 space를 누르시면 됩니다.
А
Б
В
Г
Д
Е
Ё
Ж
З
И
Й
К
Л
М
Н
О
П
Р
С
Т
У
Ф
Х
Ц
Ч
Ш
Щ
Ъ
Ы
Ь
Э
Ю
Я
а
б
в
г
д
е
ё
ж
з
и
й
к
л
м
н
о
п
р
с
т
у
ф
х
ц
ч
ш
щ
ъ
ы
ь
э
ю
я
′
″
℃
Å
¢
£
¥
¤
℉
‰
$
%
F
₩
㎕
㎖
㎗
ℓ
㎘
㏄
㎣
㎤
㎥
㎦
㎙
㎚
㎛
㎜
㎝
㎞
㎟
㎠
㎡
㎢
㏊
㎍
㎎
㎏
㏏
㎈
㎉
㏈
㎧
㎨
㎰
㎱
㎲
㎳
㎴
㎵
㎶
㎷
㎸
㎹
㎀
㎁
㎂
㎃
㎄
㎺
㎻
㎽
㎾
㎿
㎐
㎑
㎒
㎓
㎔
Ω
㏀
㏁
㎊
㎋
㎌
㏖
㏅
㎭
㎮
㎯
㏛
㎩
㎪
㎫
㎬
㏝
㏐
㏓
㏃
㏉
㏜
㏆

RISS 인기검색어
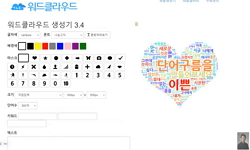
워드 크라우드를 사용하여 Q 방법론의 데이터와 결과를 시각적으로 보여주기 = Using Word Clouds to Visually Present Q Methodology Data and Findings
한글로보기https://www.riss.kr/link?id=A100938114
-
저자
Susan Ramlo (The University of Akron)
- 발행기관
- 학술지명
- 권호사항
-
발행연도
2011
-
작성언어
-
-
주제어
image ; Visual ; Q 방법론 ; 워드 크라우드 ; presentation ; word cloud ; Q methodology ; 보여주기 ; 시각 ; 이미지
-
자료형태
학술저널
-
수록면
95-108(14쪽)
- 제공처
-
0
상세조회 -
0
다운로드
부가정보
다국어 초록 (Multilingual Abstract)
Typical Q methodology studies include either tables of statements or sorting grids with statement numbers representing the views of each factor that has emerged within the study. Yet it could be useful to Q methodologists to have a simpler, more visual way to present this data to present the "big ideas" of perspectives and consensus de/ermined in these studies. In this article, the benefits of visual representations of data, especially in mixed research methods like Q methodology, are discussed. Word clouds are a method for visually presenting text data, typically keywords on websites and in this paper we present a data set as a series of word clouds and also tables and sort-grids that are more typically seen in Q methodology presentations within this journal and elsewhere.
Typical Q methodology studies include either tables of statements or sorting grids with statement numbers representing the views of each factor that has emerged within the study. Yet it could be useful to Q methodologists to have a simpler, more visual way to present this data to present the "big ideas" of perspectives and consensus de/ermined in these studies. In this article, the benefits of visual representations of data, especially in mixed research methods like Q methodology, are discussed. Word clouds are a method for visually presenting text data, typically keywords on websites and in this paper we present a data set as a series of word clouds and also tables and sort-grids that are more typically seen in Q methodology presentations within this journal and elsewhere.
국문 초록 (Abstract)
전형적인 Q 방법론은 진술문의 표나 진술문의 번호를 분류표에 분류하게 함으로써 각각의 유형의 관점을 연구 내에서 나타나게 하고 있다. 아직 Q 방법론자들에게는 이러한 연구들 내에서 “큰 생각”의 관점을 나타내는 데이터와 합의내용을 결정하고 보여주는 좀 더 단순하고 시각적인 방법이 유용할 것이다. 이 연구에서는 Q 방법론과 같은 복합 연구 방법에서 데이터의 시각적 묘사의 이점에 대해 논의하였다. 워드 크라우드는 전형적으로 웹사이트 상의 키워드인 시각적으로 문자 데이터를 나타내는 방법이며 이 논문에서 우리는 워드 크라우드의 시리즈로서의 데이타 세트를 보여주고 또한 이 저널이나 다른 저널 내에서 Q 방법론을 다룬 표와 분포도도 좀 더 전형적으로 보여주고 있다.
전형적인 Q 방법론은 진술문의 표나 진술문의 번호를 분류표에 분류하게 함으로써 각각의 유형의 관점을 연구 내에서 나타나게 하고 있다. 아직 Q 방법론자들에게는 이러한 연구들 내에서 ...
전형적인 Q 방법론은 진술문의 표나 진술문의 번호를 분류표에 분류하게 함으로써 각각의 유형의 관점을 연구 내에서 나타나게 하고 있다. 아직 Q 방법론자들에게는 이러한 연구들 내에서 “큰 생각”의 관점을 나타내는 데이터와 합의내용을 결정하고 보여주는 좀 더 단순하고 시각적인 방법이 유용할 것이다. 이 연구에서는 Q 방법론과 같은 복합 연구 방법에서 데이터의 시각적 묘사의 이점에 대해 논의하였다. 워드 크라우드는 전형적으로 웹사이트 상의 키워드인 시각적으로 문자 데이터를 나타내는 방법이며 이 논문에서 우리는 워드 크라우드의 시리즈로서의 데이타 세트를 보여주고 또한 이 저널이나 다른 저널 내에서 Q 방법론을 다룬 표와 분포도도 좀 더 전형적으로 보여주고 있다.
동일학술지(권/호) 다른 논문
-
- 한국주관성연구학회
- Gotz Kaufmann
- 2011
-
온라인 뉴스에 대한 요령있는 인터넷 사용자: Q 방법로적 접근
- 한국주관성연구학회
- Nor Hazlina Hashim
- 2011
-
- 한국주관성연구학회
- Paul Grosswiler
- 2011
-
TV 드라마 속 남자 아이돌스타에 대한 수용자 선호유형에 관한 연구
- 한국주관성연구학회
- Seung Hoon Hyun
- 2011
분석정보


이 자료와 함께 이용한 RISS 자료
나만을 위한 추천자료


